10 Must-Know Features of Chrome DevTools
Chrome has some features for debugging that can really come in handy when troubleshooting code. In fact, there are so many tools that most of them stay hidden, waiting to be uncovered.
However, the Chrome DevTools team releases monthly updates on their website and you can also find great tips shared on their official Twitter account. If you want to learn more about the tools Chrome provides, I highly recommend checking them out.
In this article, I’ve collected 10 features I use a lot and that may not be known to others. They’ve helped me streamline my workflow, so I can get more done in less time.
#1: Preserve Log
Starting with a simple one that has caused a lot of frustration in the past: preserving logs in the console. Imagine you have an issue that occurs just before a page reload or when navigation happens — you try to log on to the console but everything is cleared. The solution is simple but I didn’t know about it for ages:

#2: Breakpoints for Event Listeners
Often, an issue occurs when a user interaction happens. It can be a life safer to catch these events to inspect where and what runs on interactions. Luckily we can do this by going to the Sources tab and check the checkboxes for the relevant events:


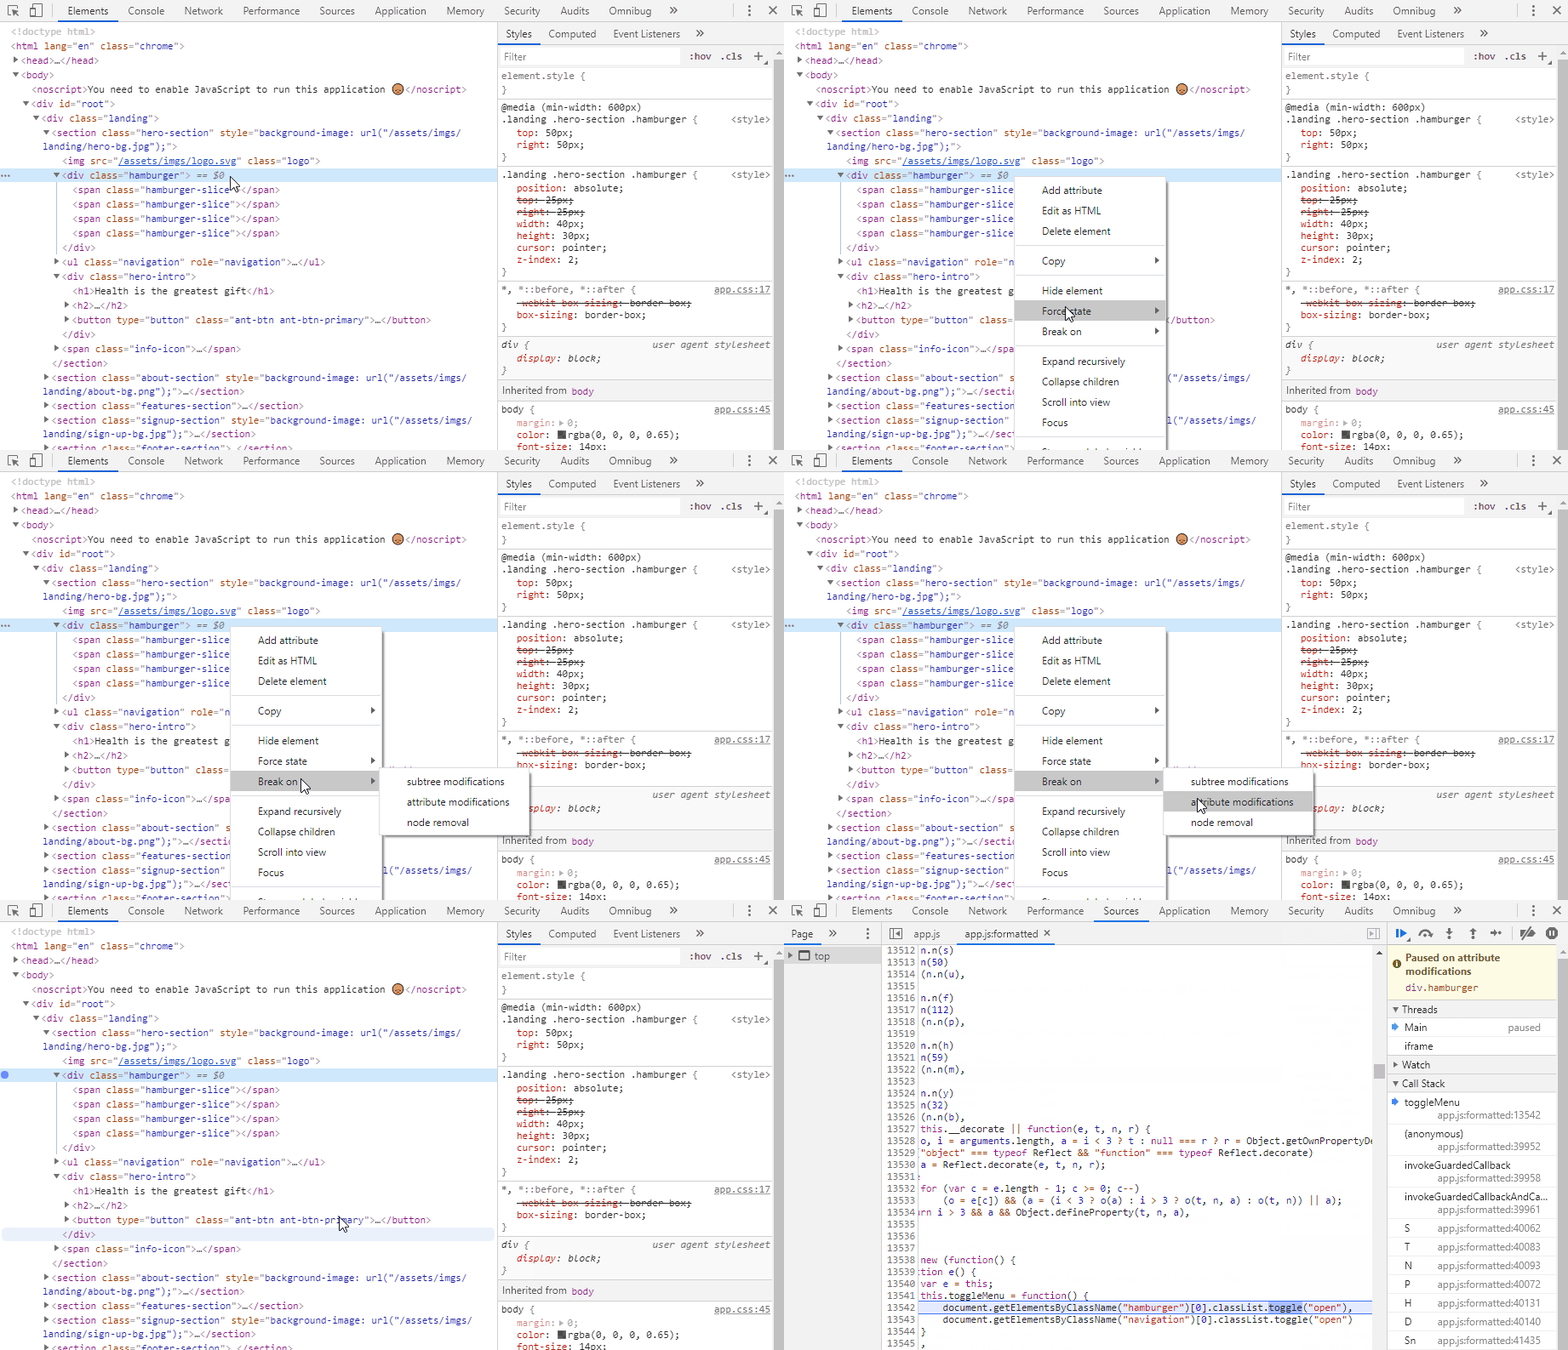
#3: Breakpoints for DOM Manipulations
The same thing can be done for DOM manipulations. It happens often that a node receives an attribute change such as the addition of classes. It would be time-consuming to search for the responsible code in a large repository — instead, you can simply add a breakpoint for the element and let DevTools handle the rest.
#4: Code Coverage
When it comes to performance optimization, we often find ourselves leaving dead code behind. With the help of the coverage tool, you can profile your resources and see which lines are not executed. It’s important to perform if not all but relevant user interactions, to get a more accurate picture. You can open the Tools panel by clicking Ctrl + Shift +P and start recording by clicking on the reload icon. Everything shown in red is not executed.

#5: Show Repaints
Unnecessary repaints can also cause performance issues. Imagine you have a countdown on your page and each update causes the whole page to be repainted. You can address these issues and see which elements trigger them by enabling paint flashing in the Render tab. Again, Ctrl + Shift + P will bring up the tools bar.

#6: Inspecting Animations
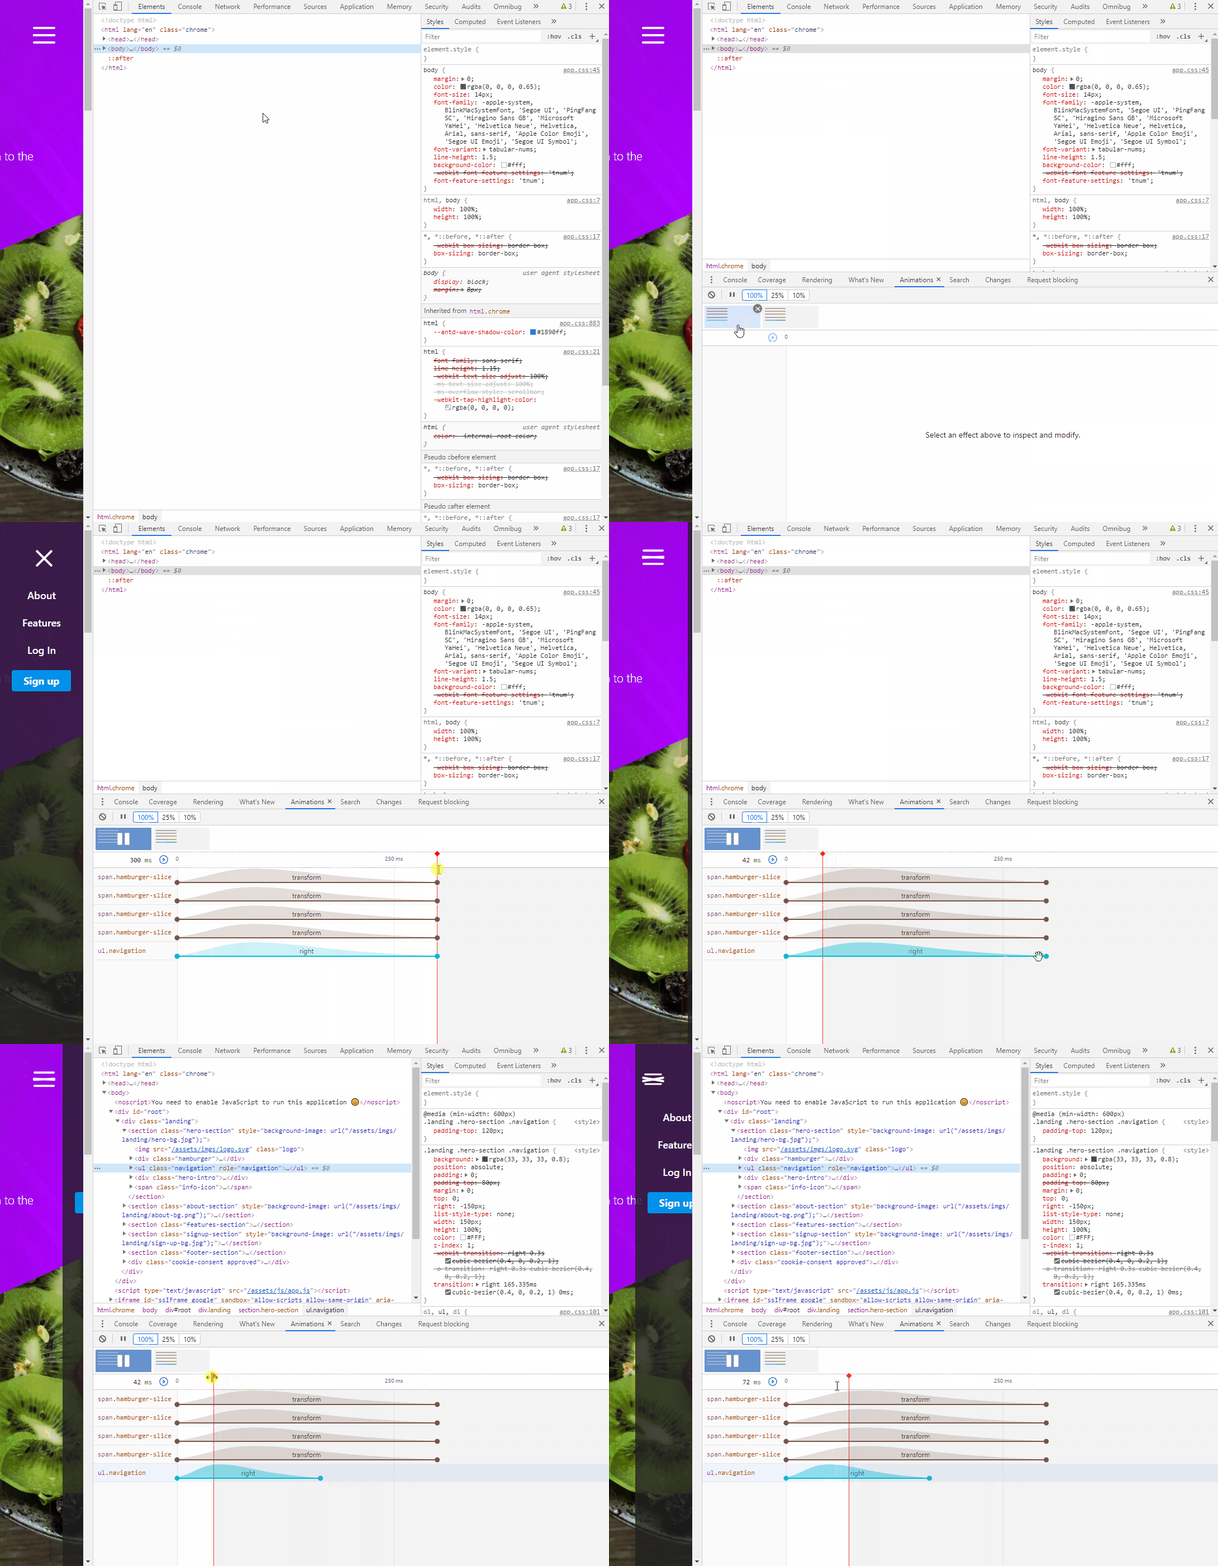
Since we’re talking about rendering, let’s take a look at how you can debug CSS animations. Open the tools menu with Ctrl + Shift + P and type in “animation.” It will open the Animations tab for you which will record any animation happening on your site. You can replay them, see their easing, and tweak around with the timing or duration:

#7: Screenshots
We often have to share screenshots with one another to verify changes. This task can burn time if you have to repeat multiple steps:
- Open a third-party application
- Crop part of the site
- Save it as an image and send it
This can be done inside DevTools. You can create images from the full page, from individual nodes (the ones that are selected) or from the viewport:

#8: Blackboxing
Imagine you’re debugging an issue and you have a couple of breakpoints in your code. You’re going down the stack trace but most are originating from core framework files such as React or jQuery. To avoid including these core files in your debugger, you can black box them, which means DevTools will skip through these files so you can focus on your own code.

#9: Local Overrides
Local Overrides is one of my favorites and I’m finding myself using it more and more often. It’s a powerful tool that enables you to load local copies of production files and use them in place of their bundled counterpart. This is especially useful when an issue only occurs in a given environment and can not be reproduced locally.
You can enable local overrides under the Sources tab. If you don’t see the Overrides link, click on the chevrons next to Page. You can copy the pretty-printed file over to your bundle and extend it. Overrides are persisted through page reloads.
If you are interested in local overrides, I have a whole tutorial covering the subject which you can reach on the link provided.

#10: Lighthouse
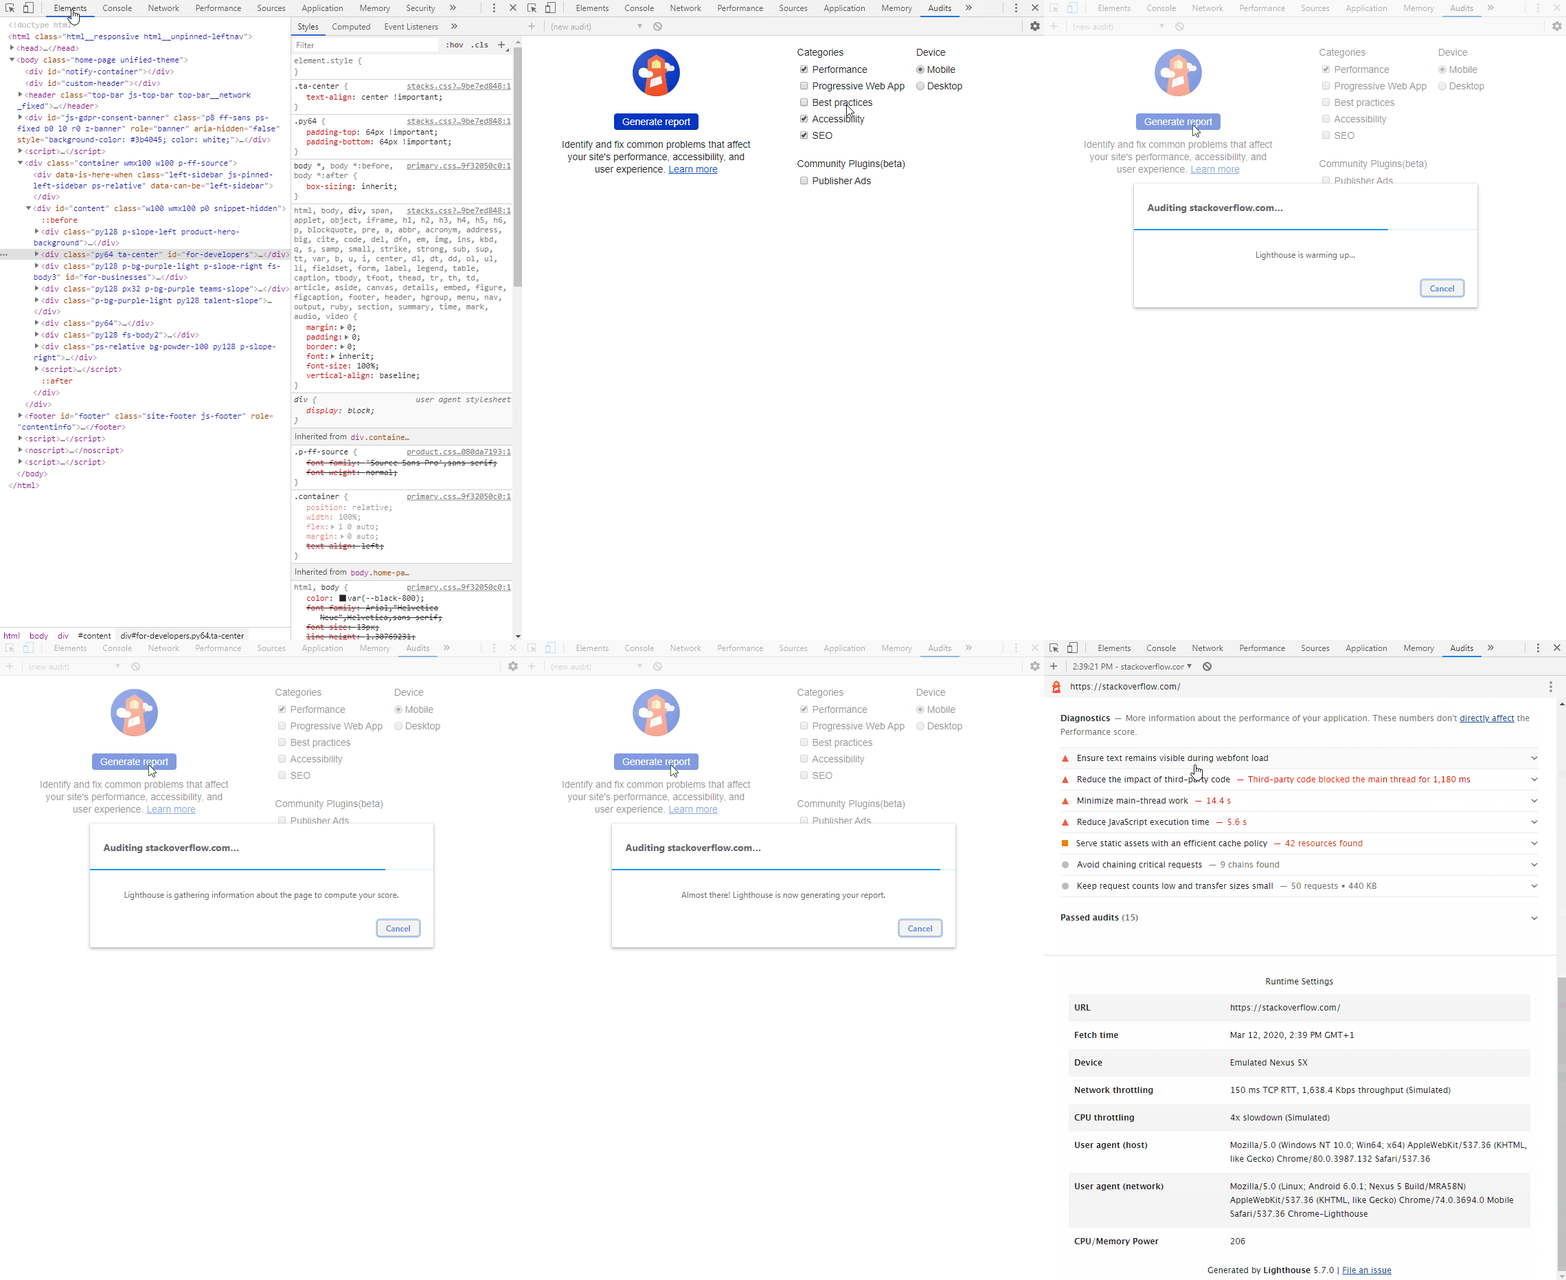
Last but not least, I find myself using the Lighthouse panel all the time. This is for auditing your site on various categories: Performance, PWA, Accessibility, or SEO. You also have the option to audit on different devices as well as emulate network connection. It gives you brief information about what can be improved and how to improve it. You can reach Lighthouse under the Audits tab. If you don’t see the tab, just click on the chevrons to reveal hidden tabs. Once your report is generated, you can save the results as a JSON file and import it later to do comparisons.
These are the 10 must-know features of Chrome’s DevTools that helped me ease my workflow and get more done in less time.
What are the features you use on a daily basis? Let us know in the comments.
Thank you for reading and happy debugging!

Rocket Launch Your Career
Speed up your learning progress with our mentorship program. Join as a mentee to unlock the full potential of Webtips and get a personalized learning experience by experts to master the following frontend technologies:
